How to Analyse User Behaviour on Your Website?
If you are reading this you’ve probably found a nice-looking domain name, taken the effort of building a website that is now in the wild. You’ve shared it with your network, friends on social media and may even be spending money to advertise it.
Building a website can be an exciting process – choosing the perfect logo, visuals, and compelling copy. But it doesn’t end there.
Depending on the goal of your website, you can do a lot more to see how site visitors interact with your website and continue making improvements. If you are a local business or a freelancer you probably want more customers to fill out the contact form or call you. As an eCommerce website, you may want all your site visitors to make a purchase.
It’s often not the case, at least when you first publish your website. It can be hard to understand why your site visitors are not doing what the site was intended for. There are a couple of handy tools that can help you do exactly this and are great at analysing on-site user behaviour.
1. Find those Problem Areas with Google Analytics
Google’s free tool should be first on your list. Not only is it easy to set up, Google Analytics can help you understand a lot about user behaviour.
- Which are the most visited pages?
- How much time do visitors spend on a particular page?
- What’s the bounce rate of a page, i.e. visitors that the left your website without going to the next page?
- Where are your visitors based?
- What are your visitors’ demographics?
While these may sound like boring statistics, they can inform and help improve your brand website significantly. Knowing your visitors’ demographics – their country, city, age, gender, and interests – can help you confirm you are reaching the right kind of visitors: i.e. your target market (those in line with your personal or business goals). If you’re not, then it’s time to review how and where you are marketing your website, because marketing that brings in people who aren’t interested in what you’ve got is wasted marketing.
Page-specific data like the page with the most number of visits, and the average time on the page can tell you what your visitors are interested in. If key pages like your homepage, product, or portfolio page aren’t performing well you at least know you need to do something different.
Oh, and while Google Analytics is the most popular option, there are ample free & paid alternatives to it.
2. Dig a Little Deeper with Hotjar
After Google Analytics has pointed out the problem areas, it’s time to dig a little deeper into user behaviour before making any changes to your website. Hotjar is a great tool to understand exactly how users interact with your website and helps identify the least and most useful elements on a specific page.
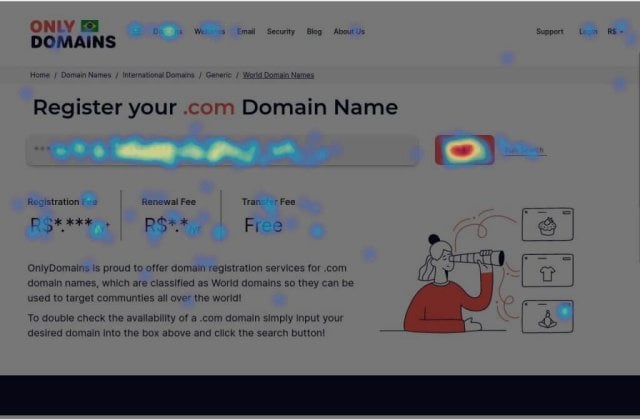
One of Hotjar’s most useful features are its heatmaps. This powerful tool let’s see what users are actually doing, and can help you determine where a specific page works, and where it doesn’t, if it’s user-friendly and caters to site visitors’ needs.
Example: Our .com landing page heatmap shows that users are most interested in searching for a domain name and understanding the pricing. This is why we’ve chosen to show both of these details in the first fold, so users don’t have to scroll and go looking for these elements.
CrazyEgg is another alternative to Hotjar and provides intel very similar to Hotjar.
3. Implement a Solution & A/B Test It
So, you’ve worked out what the most important pages on your site are with Google Analytics (or something like that) and then narrowed down the problem areas, identifying what matters with Hotjar. Now it’s time to take what you’ve learned, and use it to make some improvements: update the copy, try a different layout, or switch up your images. And then, most importantly, find work out if the changes make it better.
And that’s where A/B testing comes in.
You use A/B testing to see which of the two options (the A and the B) works the best. You can retain the original page and introduce one or two different variants with a different headline, images, or maybe CTA colours. The rule of thumb is to test one element at a time so you can isolate and measure its impact.
If you were to change the headline, images, and CTA all in one go, your new variant may perform better than the original page, but you won’t be able to identify what really made the difference.
After you’ve done a round of A/B testing, you see what worked, what didn’t, and then do it again. If last time you changed a headline, this time maybe try moving the layout around. Then test and compare. Repeating again and again to make your website the best it can be.
If you’re looking for a good way to start A/B testing, CrazyEgg is an easy, affordable tool to get started that needs no coding skills. Then, once you are ready to take it to the next level, you can consider using Google Optimize.
Finally
Hopefully, this article has given you a quick overview of how to approach analysing user behaviour and popular tools are used by marketers. But before you start, here are two important notes, one practical, and one philosophical:
First: update your legal terms & conditions to include any tools you are using and request user consent to do this. Often done using the cookie popup. It’s just something you have to do to respect user privacy and comply with global privacy regulations.
And second, accept that your website is a work in progress and not the 8th wonder of the world (yet). You’ll continue to make improvements to it, piece by piece. Remember, it’s all about marginal gains more than finding that magic bullet and conquering it all. Embrace the process.